This was raised in comments on the last post, but it should be highlighted.
There needs to be a bi-partisan investigation. If I try really hard and indulge my creative powers, I can think of innocent reasons for there being so many more votes cast in 2020, but they aren’t the reasons suggested by Occam’s Razor. Wouldn’t you think the 2024 election would have drawn more voters that in 2020, since the future of democracy was supposedly hanging in the balance?
Does the chart suggest that Republicans were cheating too, but just not as well as Democrats? If nothing else, the statistics support the need for secure, trustworthy election procedures, and we did not have them in 2020.

Conclusive proof of a 2020 election question: Joe Biden got more votes than Obama in 2008 and 2012. Joe Biden. Really? Your honor, I rest my case.
jvb
I’m DYING to post this on Facebook without comment, but the freaking out there by once intelligent and still very nice people I like and respect is too intense.
If they were children in a well-run household, they’d all be sent to their room.
In terms of boosts to voter turn out, 4 elections since 1824 have seen a greater boost than the Biden “boost”. Looking at voters as a percentage of the total population:
In 1828, 9-10% of the population voted, versus 1824, in which only 3-4% voted; a 6 % jump
In 1920, 25-26% voted, versus 1916 (18-19%); a 7% jump
In 1928, 30-31% voted, versus 1924 (25-26%); a 5% jump
In 1952, 39-40% voted, versus 1948 (33-34%); a 6% jump
The Biden boost, 47-48% of the population voted versus 2016 (42-43%); a 5% jump.
The generational trends:
1856-1916 voting percentages ranged from 14-20%
1920-1936 voting percentages saw a steady climb to the mid & upper 30%s
1940-present has seen a general trend in the upper 30s, very occasionally breaking into the lower 40s, only dipping into the lower 30s in 1948 and 1994.
Laid on a graph – The Biden Bump definitely looks like an outlier in the upward direction. The Clinton lag in his second run looks like an outlier in the downward direction.
The graph other wise has generally smooth fluctuations up and down – with the explicable drop for Lincoln’s 2nd election. The sudden rise from 1920-1936 likely due to increases in suffrage.
******This data does not take into account population of voting age or population in the past that was eligible to vote. I don’t have the time to crunch those numbers. It’s based on the census data total population only.
Percentage participation will be MUCH higher overall when taking those factors into account – which also means that the recent years of 40% and higher participation means that subtracting out the juvenile population we’re looking at incredible participation rates. Also making the 47% Biden Bump look suspicious.
I told someone last night that I hoped some small town in the UP of Michigan would send in vote totals with 200,000 votes for Trump and 50 for Harris.
You might ask “Why?” Well, I want it to happen so the world can see what happens next. Of course there will be calls for these votes to be thrown out. Hundreds of thousands of votes from a precinct with 150 registered voters is obvious fraud. But how does Michigan law handle it? The election board is REQUIRED to certify the results. After some people balked at certifying results with 120% voter turnout, they passed a new law that the board is REQUIRED to certify the results. They cannot refuse to certify, no matter what evidence of fraud. I believe they actually can face jail time. So, the 200,000 votes get certified. Well, what about a recount? Let’s say they recount and they find the machine has 100 ballots for Trump, 50 for Harris in the bucket. Under the law, if there is a discrepancy, the original reported value stands. Hence, the 200,000 votes gets counted.
I just want the world to see it in ridiculous terms. It is the only way it gets fixed.
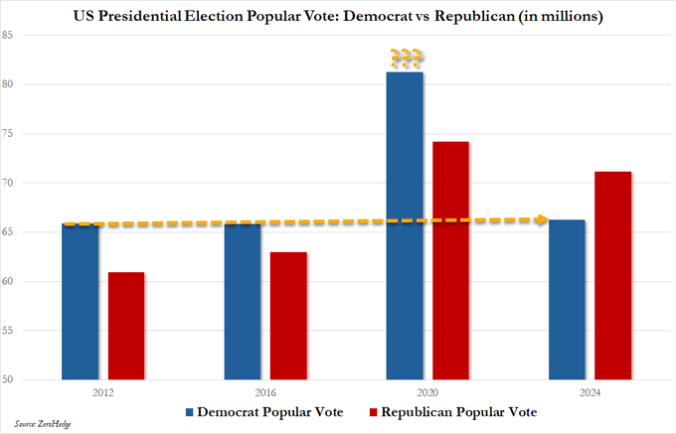
About that graph.
I know what the implication is with that bar chart graphic, but what seems obvious might not be because the election was “stolen”. There was also 20 million increase (19.33%) in voters back in the 2004 vs 2000 election, the difference is that that increase was maintained in the following elections an the 23.7 million increase (18.01%) in the 2020 election was not maintained in the 2024 election.
Here is a spread sheet chart I created from available information that’s in my recent blog post, “Can Past Presidential Election Statistical Trends Teach Us Anything Valuable Today?“
What happened is really worth a thorough investigation, but please everyone, don’t do what the Democrats have done over the last 8+ years and automatically assume nefarious motives without the competition of an investigation and evidence to support it.
Thanks
Steve
Stupid auto speller, of course the word “competition” should be “completion”.
There are still a number of votes not yet added. Trump is almost to 72 million. I think by the time its said it done he might cap 72.5. That’s only 1.5 million off from 2020. At this rate, I’m not even sure Harris is going to break 70 million. 1.5 doesn’t seem all that big but 11 is huge. Where are all these people now? Just to do a comparison, I’m gonna look at a few states:
Texas added 47000 people.
Pennsylvania added 48000 people
Florida lost 186000 people.
Michigan added 55200 people.
Vermont added 420,000 people.
I’m just really confused where all these people are at that were there last time, when it seems like a number of places are adding votes.
I find that graph very misleading when the y-axis starts at 50 million rather than 0. It makes the difference look much larger in comparison.
Showing partial 2024 results means that this chart is meaningless.
https://reason.com/volokh/2024/11/06/quick-reminder-dont-compare-the-final-2020-popular-vote-totals-with-non-final-2024-vote-totals/
Yes, one of the points I brought up in the previous post, but my even rougher guesstimate was much lower. I don’t think that ultimately there’s any there there, but it’s too early to know.
If there’s truly no “there” there, then Democrats have no one to blame but themselves for Harris’ defeat. The delta between Biden’s 81 million and Harris’ 71 million (assuming that’s where she lands) is basically Michigan’s ENTIRE population.
Republicans showed up to vote in 2024 pretty much the same as in 2020. Ten million…TEN…MILLION…Democrats abandoned Harris/Walz to their fates, and are now mad at the GOP for what they’ve done?!?
Democrats should torch their own homes and businesses.
Seems like that is the consensus. The differences between 2020 and 2024 are nonetheless stunning in many respects. “Stunning” doesn’t necessarily mean “suspicious.”
It’s fascinating to me psychologically. It suggests that millions of Democrats get riled up to vote when it means attacking and resisting the “establishment” but can’t be motivated when being called on to support it. Which could explain why Harris kept using weird language presenting herself as an outside agent of change, and painting Trump as the incumbent. It also doesn’t help that even most Democrats could feel the negative impacts of the status quo they were being asked to maintain.