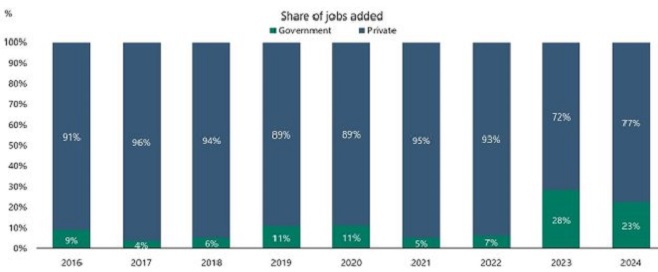
That provocative graph above is brought to you by Apollo Global Management.
It purports to reveal what proportion of new jobs added each year since 2016 were in the private and public sectors. I have no way of telling whether the numbers are accurate, whether the manner of presenting them is fair, and whether Apollo has an agenda in presenting them this way. I guess that’s the first ethics observation. It is now impossible to trust news accounts, statistics, analysis, surveys, studies and data, no matter where it comes from. We can add this to the fact that photographs, films, recordings and videos are also untrustworthy.
But here are some more observations on the off chance that the numbers are correct and can be trusted:
1. The Biden administration claiming strong job numbers when the government was doing a quarter of the hiring is pure deception.
2. It sure looks like somebody decided, “Hey, if we’re going to avoid being smoked in ’24, we better do something to goose the job numbers!”
3. Why didn’t any reporters pick up on this? Did the Axis news organizations know it, but deliberately keep it from the public? I don’t think the U.S. has functioning journalism any more. A 400% jump in government hiring is a pretty big elephant to ignore.
4. The government hiring lots of people to keep the peasants from turning on it is a well-worn Communist/Socialist tactic. It was a significant part of FDR’s desperate efforts to keep the public from freaking out during the Great Depression: ultimately the military employed so many people that the job situation improved. Here is Washington, D.C., “Mayor-For-Life” political boss Marion Barry thrived by hiring constituents and earning their undying loyalty and gratitude. What the Biden administration was doing cooked the books, rigged the stats, and amounted to using taxpayer money to buy votes: is that an unfair conclusion?
5. How can anyone consider the government job explosion in ’23 and ’24 and strenuously object to the DOGE campaign to cut the federal workforce? I do wish that chart distinguished between state, local and national government hires…
6. The previous post noted how the Biden Administration falsely reported border “arrests.” That administration gave us fake job statistics, fake Wuhan virus statistics, fake arrest statistics, and a fake President. Did you know Donald Trump lies all the time?

ZeroHedge has been reporting on all this book cooking for quite some time, such as in this article.
The Biden Administration was a never-ending game of lies, deception, book-cooking, and smoke-and-mirrors to make statistics look good to fool the populace about the reality on the ground. The inflation numbers were false. The unemployment numbers (which many previous administrations had cooked to make them look better) were faked beyond belief. The multiple recessions we endured were waved away by the magic of redefinition. Trillions of dollars were poured out at strategic times to prop up the GDP, in the same way our strategic petroleum reserves were drained to head off terrible gas prices right before elections. Was there anything the Biden Administration said that wasn’t a lie?
“…the votes for President of the United States are as follows: Donald J. Trump, of the state of Florida, has received 312 votes. Kamala D. Harris, of the state of California, has received 226 votes.”
— Kamala Harris
Touché!
“The inflation numbers were false.”
At least with inflation, it’s a lot more obvious to most Americans when the reported numbers are false, because when they say it’s something like 5% yet the prices of many things very nearly double, you know something is rotten in the state of Denmark.
–Dwayne
“I have no way of telling whether the numbers are accurate, whether the manner of presenting them is fair, and whether Apollo has an agenda in presenting them this way.”
“A 400% jump in government hiring is a pretty big elephant to ignore.”
I recognize your initial disclaimer. And I am not here to defend the Biden Administration, but since the numbers are just percentages, it is not fair to say there is a 400% jump in government hiring, implying, at least, that the government went on a hiring spree. It may very well be, and I have no data, that the federal or any other government included in the graph didn’t appreciably change its numbers but the private sector reduced its hiring. It could very well be some point between (more likely).
Representing hiring as percentages is potentially misleading as it only tells part of a story. It is likely done to drive an agenda. Again, I am not trying to defend Biden’s government or any other that is captured in the graph. (It does feel odd calling the federal government Biden’s, given his state of mind through that whole term).
Should we call it the Klain Administration? The Jake Sullivan Administration? The Antony Blinken Administration? Maybe Biden Administration is accurate if it means the Dr. Jill Biden Administration.
OB – Any name would imply accountability.
JLo,
I came to make the same point. I think an illustration may help:
2022: 100 jobs added; 93 Private (93%); 7 Public (7%)
2023: 25 jobs added; 18 Private (72%); 7 public (28%)
So, with no change in hiring, there is a 400% “jump” (which is not really a “jump” at all. The numbers are accurate but not very informative. There are likely several moving parts in these scenarios and just one cross-section of information is presented.
In my example, my question would be: Why has there been such a drop in hiring in the private sector, with no similar change in the public sector? The Answer: The Government thinks it is immune from market forces.
-Jut
After two (2) demonstrably laggard years (2021-22), the scale required a ham fist; it got one.
PWS