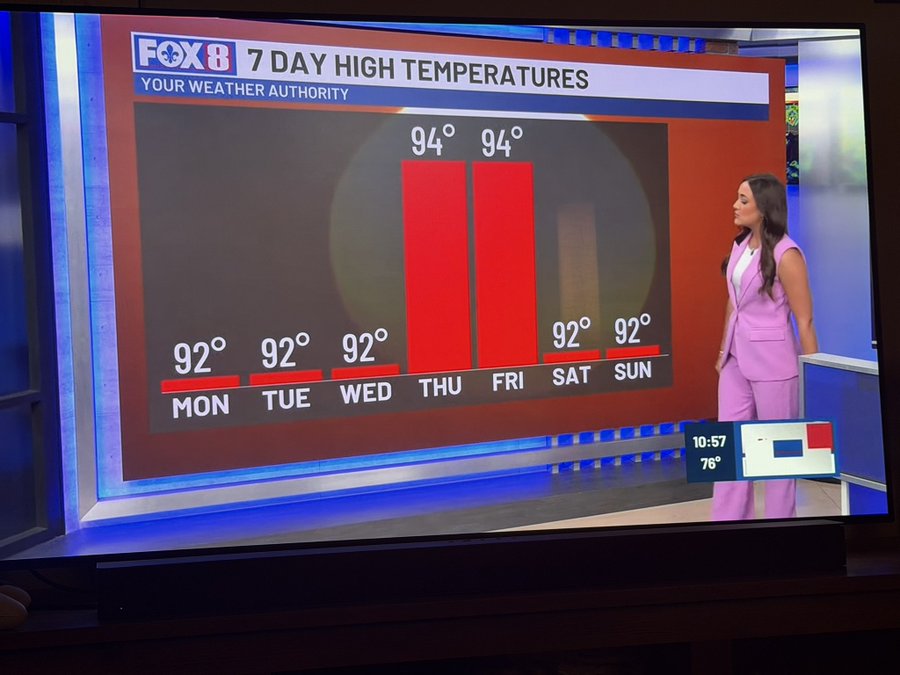
This is the second EA reference to “IQ 83” in a week, strongly suggesting that “The Great Stupid” is not slowing down, and may be accelerating.
There really isn’t much more to be said, is there?
This is the second EA reference to “IQ 83” in a week, strongly suggesting that “The Great Stupid” is not slowing down, and may be accelerating.
There really isn’t much more to be said, is there?


someone missed how to form a bar graph in school!
Does she work in HR?
When I saw this, I immediately recalled a similar bar graph in the book, “How to Lie with Statistics.” (If you have not heard of it, it is an easy read and is good for developing critical thinking.) As I recall, there is technically nothing wrong with that bar graph, except that it conveys the information poorly (intentionally or not).
Based upon that, two inferences are possible: 1) the creator of the graph is stupid; or 2) the creator of the graph is trying to manipulate stupid people.
But, to the larger point, whether the creator of the graph is stupid, or manipulative, neither option is an ethical one.
-Jut
But 94 is soooo much more biggly than 92.
How would people react if this was a graph of wage increase?
it is covfefe bigly.
I think what we have here is a graph produced with automatic Y-axis scaling, under the “control” of someone who doesn’t know how to manually set the scale. Yes, it’s a sign of incompetence at the spreadsheet. Most of the time, there will be a moderate range of temperatures, so auto-scaling is acceptable. I doubt that they had the technical ability to consider composing an “alarming” graph.
Looks to me as if someone in the studio didn’t know how to run the program that produces that screen. Underpaid staff the more likely culprit.